Data 2 Go
A summary of a Hyperact lunch talk about the creation of a web-based app called data2gonyc – described as a herculean accomplishment by those in attendance
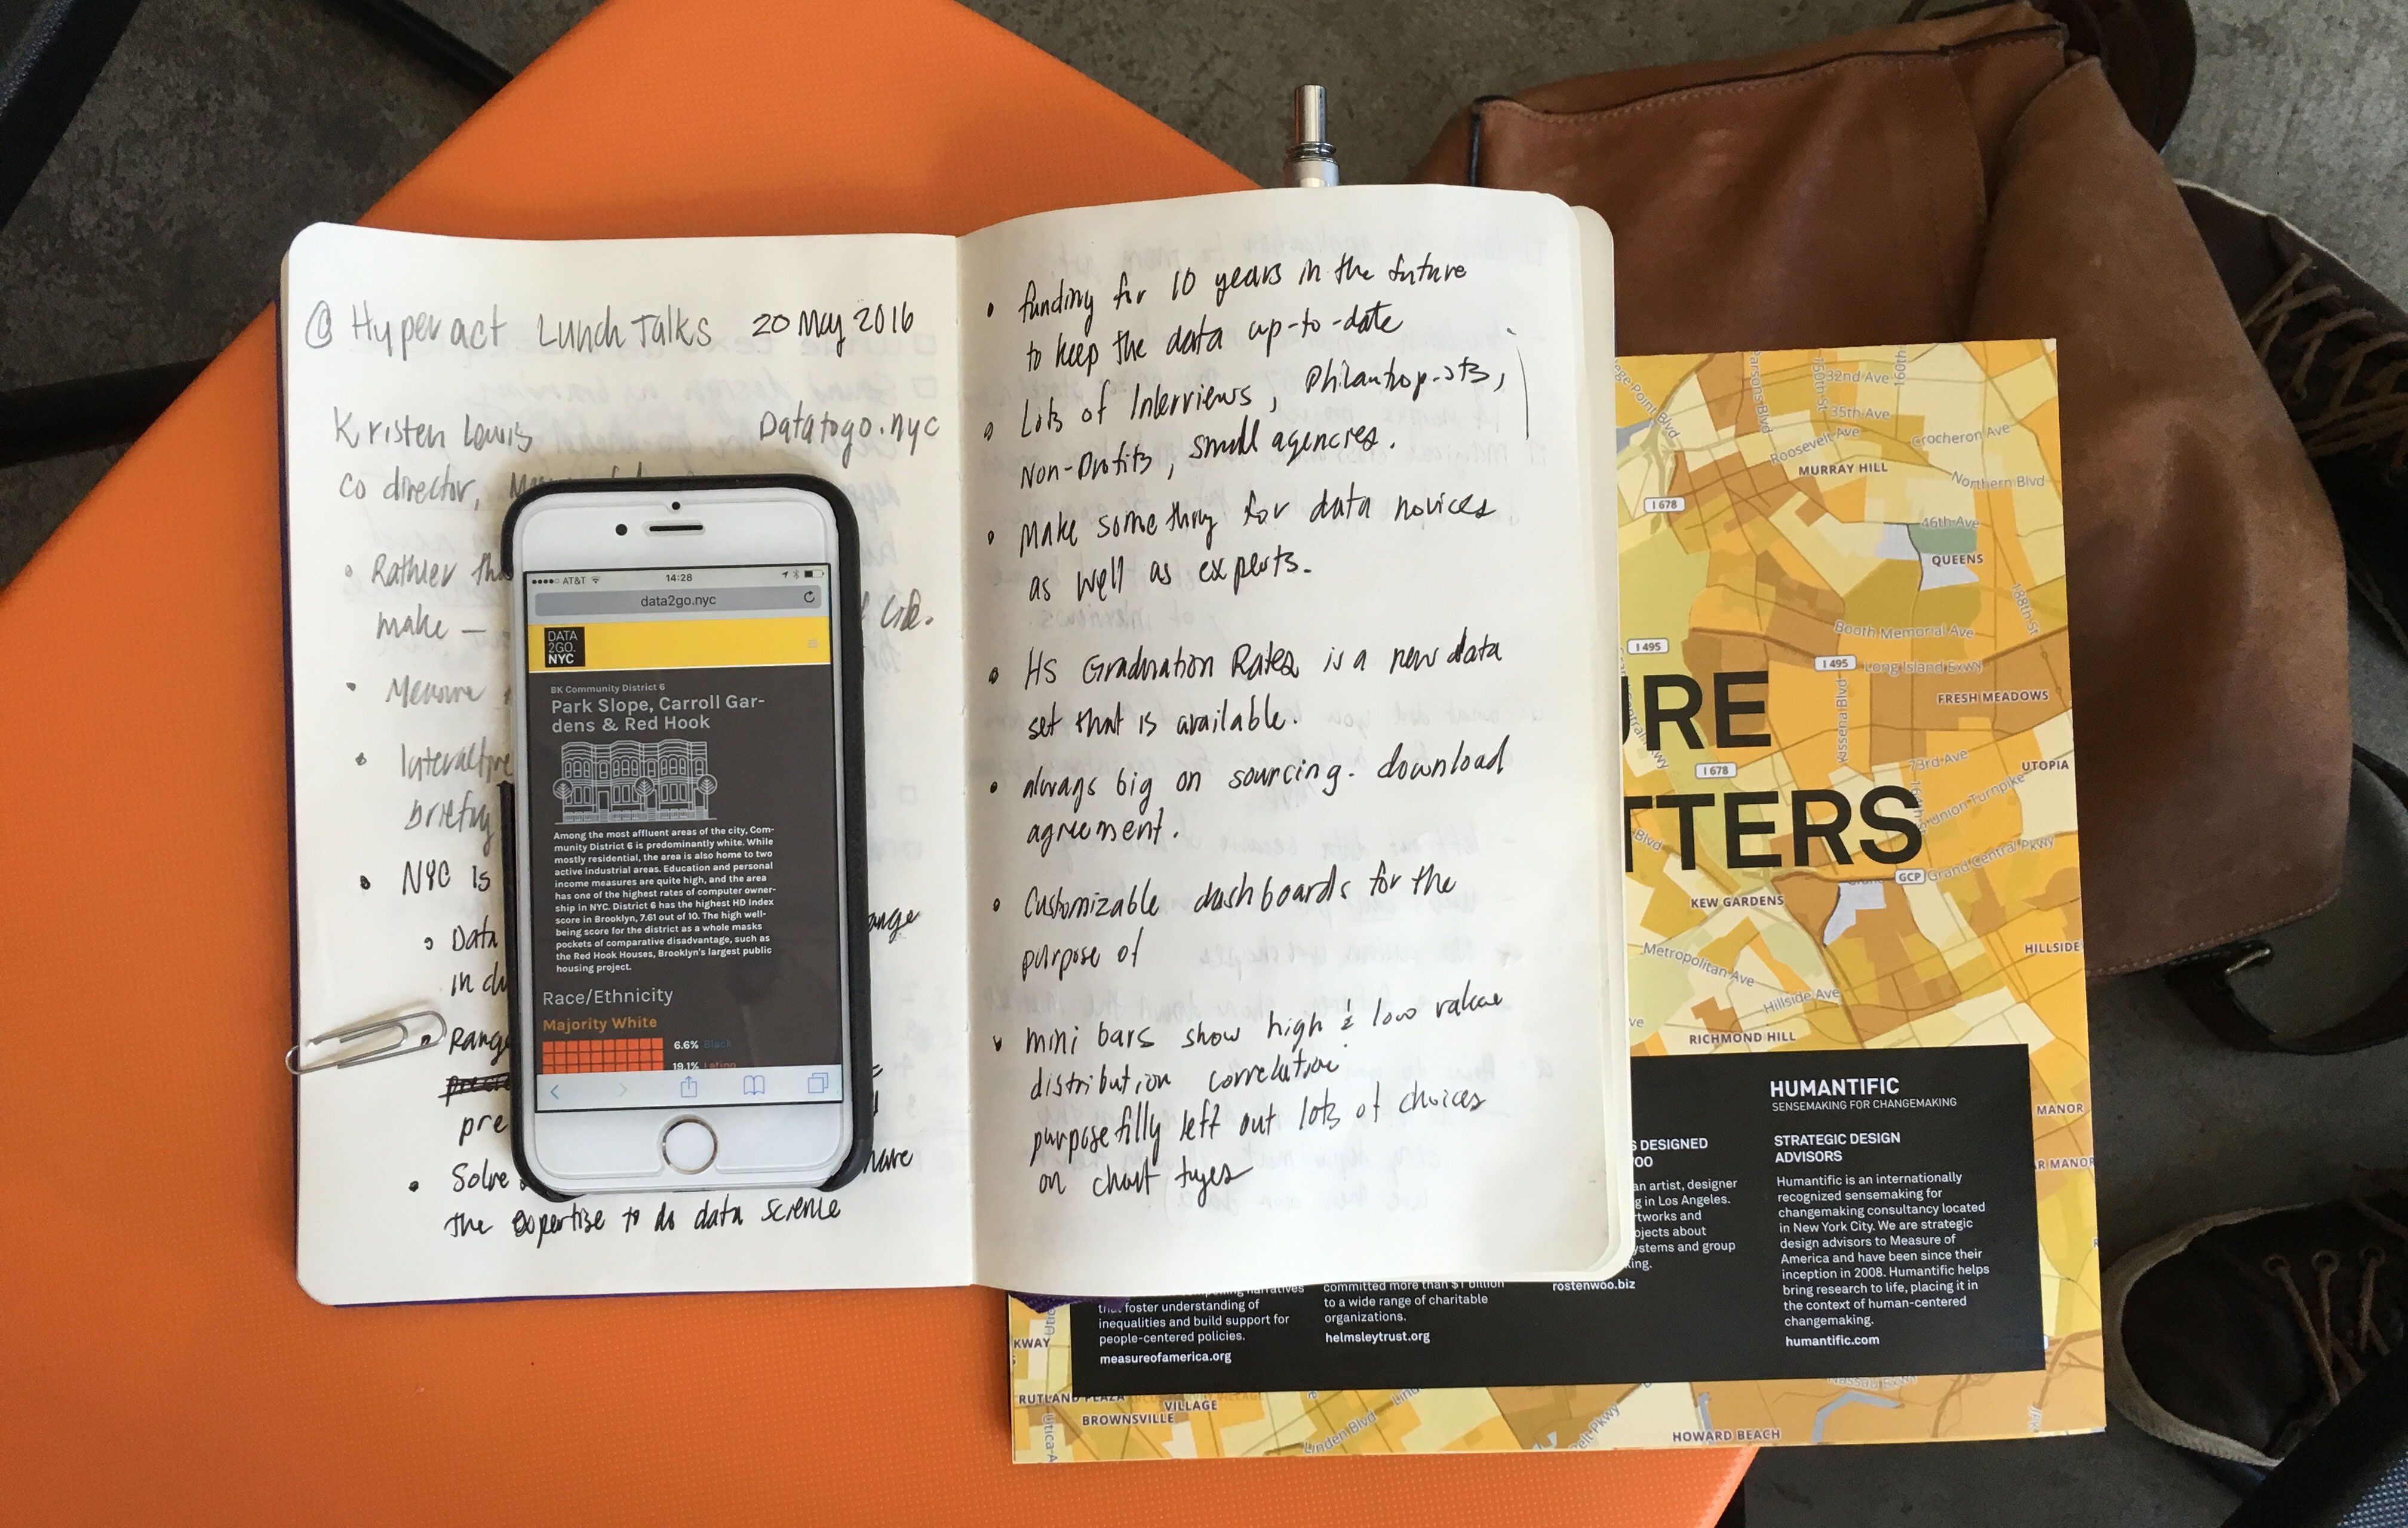
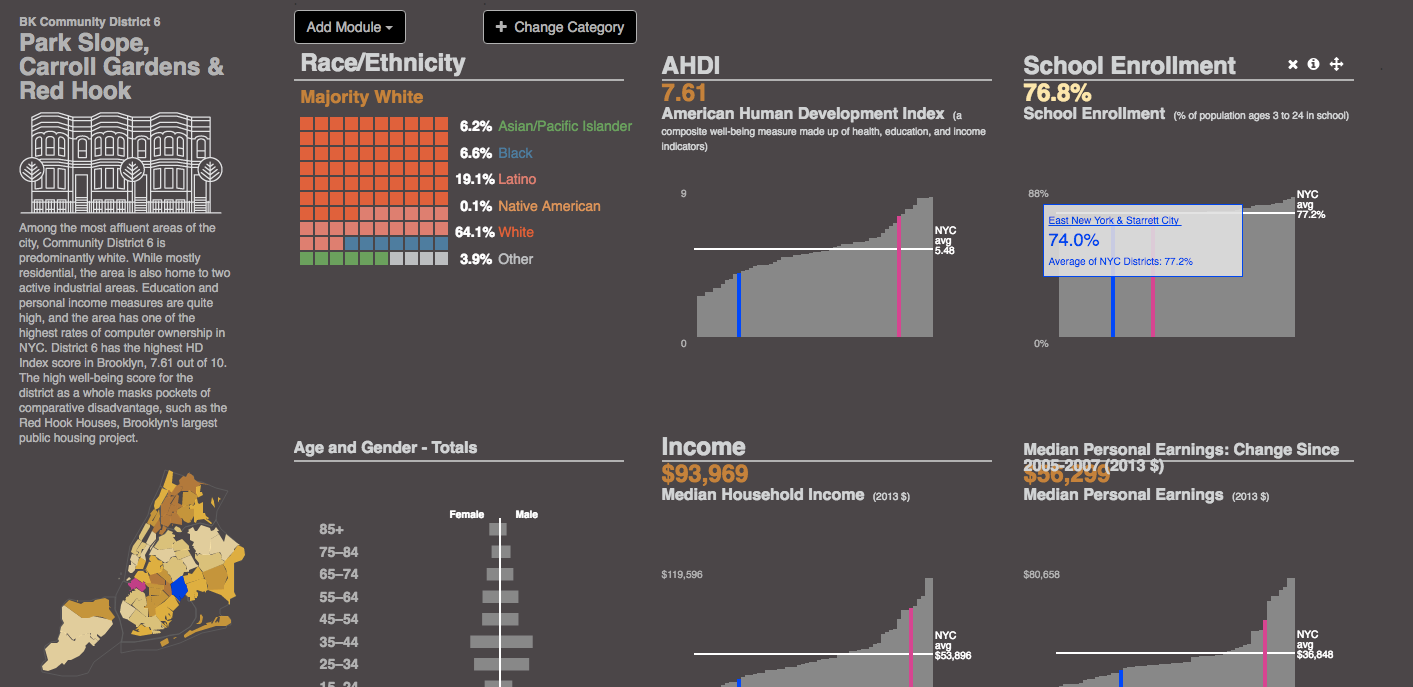
On Friday, 20 May 2016, Hyperact hyperakt.com/lunch-talks/ hosted a lunch talk with speaker Kristen Lewis. Kristen is the Co-director of Measure of America — an organization that provides easy-to-use yet methodologically sound tools for understanding the distribution of well-being and opportunity in America and stimulating fact-based dialogue about issues we all care about: health, education, and living standards measureofamerica.org/project/. This specific event covered a recently launched product called data2go.nyc.
Data2go.nyc is a web based interface that solves for the data needs of non-profits, philanthropists, grant writers, small agencies and other types of organizations who may not have the expertise or resources to conduct data science.
Kristen's presentation consisted solely of a live demo. Using the data2go map and dashboards to illustrate features, functions and use cases:
Background #
- The overall goal of the project was talk about quality of life in cities rather than using a measure of how much $ we make
- NYC is a data rich city, but often it takes quite a bit of expertise to work with the data sources, data2go saught to make something for data novices as well as experts (often they called their audience data civilians)
- Data2go was focused on filling gaps that are currently found with other products such as nyc open data or other cities that do a good job making data available. The difference with data to go is that they don't want to provide information for just one sector but for a range (i.e. housing, education, and many more) within a constant geographic area. For example a police precinct does not equal a housing neighborhood. The data2go application does a lot of fancy cross-walk of data behind the scenes in order to make the app user friendly for the audience types the project targets
- Data2go.nyc has funding for 10 years to keep the application up-to-date on a yearly cyle. This is uncommon for this type of project. Grants normally last for only 1-3 years
- Working with the data sounds like it may have been the most challenging part of the project; but Kristen stated that conducting hundreds of interviews of Philanthropists, non-profits, grant writers, and small agencies took the most time.
- The team found that they got the most press, not from the launch of the app itself, but from the publishing of a new data set that they worked on covering High School Graduation rates. This previously unavailable (non-normalized) source of data about NYC was previously unavailable.
- The foundation was started in 2007 and supports the data2go project in a series of rounds. The first round took 14 months and cost approx. $750K
Technical items #
-
The team decided to simplify the interface and use mini bars to show high and low values. This cart type also some elements of distribution and correlation. The team purposefully left out a lot of chart types and options in order to keep the interface simple.
-
Within the interface there are no listed margins of error or data sources. This is the case because most of data2go users do not know what these things are. Expert users on the other hand can download the data sets by clicking the information icon. When they do these downloads include all kinds of sourcing information and extra attributes of the data like margins of error
-
Many features and functions were left out because of the interview process. This was the key way to prioritize features based on the needs of the intended audience (grant writers, non-profits, small agencies, ect). The ideas of consistency and experience were really important. Users can't put in their own data. There are no custom user shapes. More features slow down the interface — speed and performance budget was a very important experience for the interface.
-
Another large part of the project was the political work. This was as time consuming as the interviews, design and development work. The team had to convince data sources to share their data and change the culture of interagency departments so that they can think in a data-first mindse
How do you measure success? #
-
Funny enough, a lot of downloads are from the city departments that generated the original data. The data2go application allows the city department to use their own data in an efficient manner
-
A lot of grant writers download the data and visit the site as well as lots of non-profits, affinity groups, agencies, community districts. it is really important to know who is using the site so that the team can make continuous improvements.
-
The team is always looking for "opportunity data." One good example is ways in which the census data could be improved
-
The team is always suprized to see people use the application in unexpected ways. So much so that the organization offers 10K grants in the form of a data visualization challenge using the data2go resources (data2go.nyc/datavizchallenge